रैखिक समीकरण युग्म का ग्राफीय विधि से हल: Difference between revisions
No edit summary |
No edit summary |
||
| Line 1: | Line 1: | ||
When the mathematical expressions of variables and constants along with the mathematical operations form an equation of the highest degree one, it is said to be a linear equation. A linear equation is an algebraic equation between variables that gives a straight line when plotted on a graph. A linear equation of one variable is of the form <math>ax+b=0</math> where <math>x</math> is the variable. Linear equations of two variables are of the form <math>ax+by+c=0</math> where <math>x</math> and <math>y</math> are the two variables and <math>c</math> is the constant. A pair of linear equations can be solved and represented using two basic methods: graphical method and algebraic method. In this lesson, we will explore solving a system of two linear equations using graphical method. | |||
== Solving Pair of Linear Equation Graphically == | |||
Every linear equation consists of variables. Linear equations are of the first order and they may involve one or two variables. When it comes to solving linear equations using graphical method the basic approach is to represent them as straight lines on a graph and find the points of intersection, if any. We can obtain at least two solutions easily by substituting the values for <math>x</math>, finding the <math>x</math> and <math>y</math> intercepts and plotting them geometrically on the graph. Let us have a look at the standard form of a pair of linear equations here. | |||
<math>a_1x+b_1y+c_1=0 ....(1)</math> | |||
<math>a_2x+b_2y+c_2=0 ....(2)</math> | |||
Solution for the equations varies according to the position of the lines. | |||
'''Types of Solutions''' | |||
* '''Consistent :''' The pair of equations is said to be consistent, if the two lines are intersecting at the same point, then the point gives unique solution for both the equations. | |||
* '''Dependent :''' The pair of equations is said to be dependent, if the two lines coincide, then in this case there are infinitely many solutions. Each and every point on a line becomes a solution. | |||
* '''Inconsistent :''' The pair of equations is said to be inconsistent, if the two lines are parallel, then in this case there is no solution. | |||
Consider the following three pairs of equations. | |||
(i) <math>x-2y=0</math>and <math>3x+4y-20=0</math> (The lines intersect) | |||
(ii) <math>2x+3y-9=0</math> and <math>4x+6y-18=0</math> (The lines coincide) | |||
(iii) <math>x+2y-4=0</math> and <math>2x+4y-12=0</math> (The lines are parallel) | |||
Let us write down, and compare, the values of <math>\frac{a_1}{a_2},\frac{b_1}{b_2},\frac{c_1}{c_2}</math> | |||
in all the three examples. Here <math>a_1,b_1,c_1</math>and <math>a_2,b_2,c_2</math> denote the coefficients of equations given in in the general form <math>(1) </math>and (2) | |||
{| class="wikitable" | |||
|+ | |||
!Sl.No. | |||
!Pair of Lines | |||
!<math>\frac{a_1}{a_2}</math> | |||
!<math>\frac{b_1}{b_2}</math> | |||
!<math>\frac{c_1}{c_2}</math> | |||
!Compare the ratios | |||
!Graphical representation | |||
!Algebraic Interpretation | |||
|- | |||
|1 | |||
|<math>x+3y-6=0</math> | |||
<math>2x-3y-12=0</math> | |||
!<math>\frac{1}{2}</math> | |||
!<math>\frac{3}{-3}</math> | |||
!<math>\frac{-6}{-12}</math> | |||
!<math>\frac{a_1}{a_2} \ne \frac{b_1}{b_2}</math> | |||
|Intersecting lines | |||
|Exactly one solution (unique) | |||
|- | |||
|2 | |||
| | |||
<math>2x+3y-9=0 </math> | |||
<math>4x+6y-18=0</math> | |||
!<math>\frac{2}{4}</math> | |||
!<math>\frac{3}{6}</math> | |||
!<math>\frac{-9}{-18}</math> | |||
!<math>\frac{a_1}{a_2}=\frac{b_1}{b_2}=\frac{c_1}{c_2}</math> | |||
|Coincident lines | |||
|Infinitely many solutions | |||
|- | |||
|3 | |||
|<math>x+2y-4=0</math> | |||
<math>2x+4y-12=0</math> | |||
!<math>\frac{1}{2}</math> | |||
!<math>\frac{2}{4}</math> | |||
!<math>\frac{-4}{-12}</math> | |||
!<math>\frac{a_1}{a_2}=\frac{b_1}{b_2}\ne \frac{c_1}{c_2}</math> | |||
|Parallel lines | |||
|No Solution | |||
|} | |||
From the table above, if the lines represented by the equation | |||
<math>a_1x+b_1y+c_1=0 ....(1)</math> and <math>a_2x+b_2y+c_2=0 ....(2)</math> are | |||
* intersecting , then <math>\frac{a_1}{a_2}\ne \frac{b_1}{b_2}</math> | |||
* coincident , then <math>\frac{a_1}{a_2}=\frac{b_1}{b_2}= \frac{c_1}{c_2}</math> | |||
* parallel , then <math>\frac{a_1}{a_2}=\frac{b_1}{b_2}\ne \frac{c_1}{c_2}</math> | |||
== Examples == | |||
1. Check graphically whether the pair of equations | |||
{| class="wikitable" | |||
|- | |||
|<math>x+3y-6=0</math> | |||
<math>2x-3y-12=0</math> | |||
|}is consistent. If so, solve them graphically. | |||
'''Solution:''' | |||
{| class="wikitable" | |||
|<math>x</math> | |||
|<math>0</math> | |||
|<math>6</math> | |||
|- | |||
|<math>y=\frac{6-x}{3}</math> | |||
|<math>2</math> | |||
|<math>0</math> | |||
|} | |||
{| class="wikitable" | |||
|+ | |||
|<math>x</math> | |||
|<math>0</math> | |||
|<math>3</math> | |||
|- | |||
|<math>y=\frac{2x-12}{3}</math> | |||
|<math>-4</math> | |||
|<math>-2</math> | |||
|} | |||
Plot the points on the graph paper | |||
* <math>(0,2)</math>, <math>(6,0)</math> and join the points to form the lines | |||
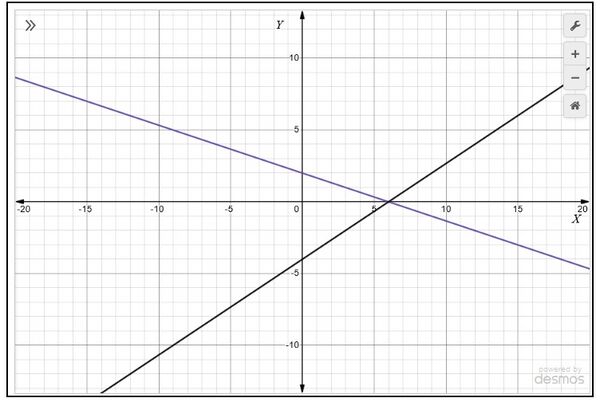
* <math>(0,-4)</math> <math>(3,-2)</math> and join the points to form the lines as shown in Fig. 1. | |||
[[File:Graph-1.jpg|alt=Fig.1|none|thumb|600x600px|Fig.1]] | |||
We observe that there is a point at <math>(6,0)</math> common to both the lines . So, the solution of the pair of linear equations is <math>x=6</math> and <math>y=0</math>, i.e., the given pair of equations | |||
is consistent. | |||
2. Check graphically whether the pair of equations | |||
{| class="wikitable" | |||
|- | |||
| | |||
<math>2x+3y-9=0 </math> | |||
<math>4x+6y-18=0</math> | |||
|}has infinitely many solutions. If so, solve them graphically. | |||
'''Solution:''' | |||
{| class="wikitable" | |||
|<math>x</math> | |||
|<math>3</math> | |||
|<math>6</math> | |||
|- | |||
|<math>y=\frac{9-2x}{3}</math> | |||
|<math>1</math> | |||
|<math>-1</math> | |||
|} | |||
{| class="wikitable" | |||
|<math>x</math> | |||
|<math>3</math> | |||
|<math>6</math> | |||
|- | |||
|<math>y=\frac{18-4x}{6}</math> | |||
|<math>1</math> | |||
|<math>-1</math> | |||
|} | |||
Plot the points on the graph paper | |||
* <math>(3,1)</math>, <math>(6,-1)</math> and join the points to form the lines | |||
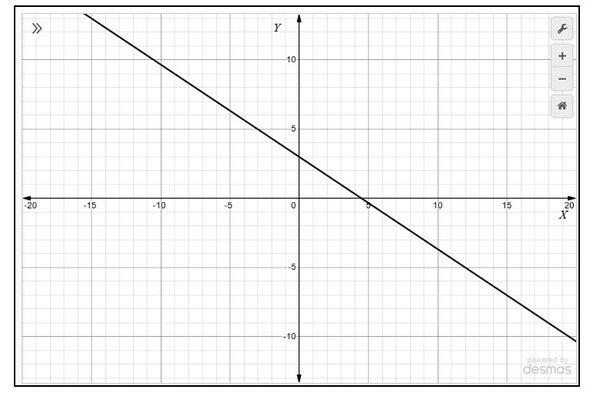
* <math>(3,1)</math> <math>(6,-1)</math> and join the points to form the lines as shown in Fig. 2. | |||
[[File:Graph-4.jpg|alt=Fig. 2|none|thumb|600x600px|Fig. 2]] | |||
We observe that each and every point on a line becomes a solution. So, the solution of the pair of linear equations has infinitely many solutions. | |||
3. Check graphically whether the pair of equations | |||
{| class="wikitable" | |||
|- | |||
|<math>x+2y-4=0</math> | |||
<math>2x+4y-12=0</math> | |||
|} | |||
has no solution, If so, solve them graphically. | |||
'''Solution:''' | |||
{| class="wikitable" | |||
|<math>x</math> | |||
|<math>0</math> | |||
|<math>2</math> | |||
|- | |||
|<math>y=\frac{4-x}{2}</math> | |||
|<math>2</math> | |||
|<math>1</math> | |||
|} | |||
{| class="wikitable" | |||
|<math>x</math> | |||
|<math>0</math> | |||
|<math>2</math> | |||
|- | |||
|<math>y=\frac{12-2x}{4}</math> | |||
|<math>3</math> | |||
|<math>2</math> | |||
|} | |||
Plot the points on the graph paper | |||
* <math>(0,2)</math>, <math>(2,1)</math> and join the points to form the lines | |||
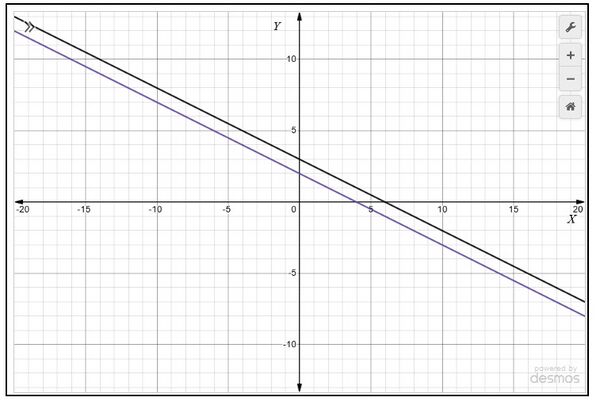
* <math>(0,3)</math> <math>(2,2)</math> and join the points to form the lines as shown in Fig. 3 | |||
[[File:Graph-parallel.jpg|alt=Fig. 3|none|thumb|600x600px|Fig. 3]] | |||
We observe that lines are not crossing and are parallel to each other . So, the pair of linear equations has no solution. | |||
[[Category:दो चर वाले रैखिक समीकरण युग्म]] | [[Category:दो चर वाले रैखिक समीकरण युग्म]] | ||
[[Category:गणित]] | [[Category:गणित]] | ||
[[Category:कक्षा-10]] | [[Category:कक्षा-10]] | ||
Revision as of 22:02, 18 September 2024
When the mathematical expressions of variables and constants along with the mathematical operations form an equation of the highest degree one, it is said to be a linear equation. A linear equation is an algebraic equation between variables that gives a straight line when plotted on a graph. A linear equation of one variable is of the form where is the variable. Linear equations of two variables are of the form where and are the two variables and is the constant. A pair of linear equations can be solved and represented using two basic methods: graphical method and algebraic method. In this lesson, we will explore solving a system of two linear equations using graphical method.
Solving Pair of Linear Equation Graphically
Every linear equation consists of variables. Linear equations are of the first order and they may involve one or two variables. When it comes to solving linear equations using graphical method the basic approach is to represent them as straight lines on a graph and find the points of intersection, if any. We can obtain at least two solutions easily by substituting the values for , finding the and intercepts and plotting them geometrically on the graph. Let us have a look at the standard form of a pair of linear equations here.
Solution for the equations varies according to the position of the lines.
Types of Solutions
- Consistent : The pair of equations is said to be consistent, if the two lines are intersecting at the same point, then the point gives unique solution for both the equations.
- Dependent : The pair of equations is said to be dependent, if the two lines coincide, then in this case there are infinitely many solutions. Each and every point on a line becomes a solution.
- Inconsistent : The pair of equations is said to be inconsistent, if the two lines are parallel, then in this case there is no solution.
Consider the following three pairs of equations.
(i) and (The lines intersect)
(ii) and (The lines coincide)
(iii) and (The lines are parallel)
Let us write down, and compare, the values of
in all the three examples. Here and denote the coefficients of equations given in in the general form and (2)
| Sl.No. | Pair of Lines | Compare the ratios | Graphical representation | Algebraic Interpretation | |||
|---|---|---|---|---|---|---|---|
| 1 |
|
Intersecting lines | Exactly one solution (unique) | ||||
| 2 |
|
Coincident lines | Infinitely many solutions | ||||
| 3 |
|
Parallel lines | No Solution |
From the table above, if the lines represented by the equation
and are
- intersecting , then
- coincident , then
- parallel , then
Examples
1. Check graphically whether the pair of equations
|
|
is consistent. If so, solve them graphically.
Solution:
Plot the points on the graph paper
- , and join the points to form the lines
- and join the points to form the lines as shown in Fig. 1.
We observe that there is a point at common to both the lines . So, the solution of the pair of linear equations is and , i.e., the given pair of equations
is consistent.
2. Check graphically whether the pair of equations
|
|
has infinitely many solutions. If so, solve them graphically.
Solution:
Plot the points on the graph paper
- , and join the points to form the lines
- and join the points to form the lines as shown in Fig. 2.
We observe that each and every point on a line becomes a solution. So, the solution of the pair of linear equations has infinitely many solutions.
3. Check graphically whether the pair of equations
|
|
has no solution, If so, solve them graphically.
Solution:
Plot the points on the graph paper
- , and join the points to form the lines
- and join the points to form the lines as shown in Fig. 3
We observe that lines are not crossing and are parallel to each other . So, the pair of linear equations has no solution.


