रैखिक समीकरण युग्म का ग्राफीय विधि से हल: Difference between revisions
(added content) |
(added content) |
||
| Line 25: | Line 25: | ||
(iii) <math>x+2y-4=0</math> और <math>2x+4y-12=0</math> (रेखाएँ समांतर हैं ) | (iii) <math>x+2y-4=0</math> और <math>2x+4y-12=0</math> (रेखाएँ समांतर हैं ) | ||
आइए उपर्युक्त तीनों उदाहरणों में <math>\frac{a_1}{a_2},\frac{b_1}{b_2},\frac{c_1}{c_2}</math> के मान लिखें और उनकी तुलना करें। | |||
यहाँ <math>a_1,b_1,c_1</math>और <math>a_2,b_2,c_2</math> सामान्य रूप <math>(1) </math> और <math>(2)</math> में दिए गए समीकरणों के गुणांकों को दर्शाता है | |||
{| class="wikitable" | {| class="wikitable" | ||
|+ | |+ | ||
! | !क्रमांक | ||
! | !रेखाओं का युग्म | ||
!<math>\frac{a_1}{a_2}</math> | !<math>\frac{a_1}{a_2}</math> | ||
!<math>\frac{b_1}{b_2}</math> | !<math>\frac{b_1}{b_2}</math> | ||
!<math>\frac{c_1}{c_2}</math> | !<math>\frac{c_1}{c_2}</math> | ||
! | !अनुपातों की तुलना | ||
! | !आलेखीय विधि | ||
! | !बीजगणितीय व्याख्या | ||
|- | |- | ||
|1 | |1 | ||
| Line 47: | Line 48: | ||
!<math>\frac{-6}{-12}</math> | !<math>\frac{-6}{-12}</math> | ||
!<math>\frac{a_1}{a_2} \ne \frac{b_1}{b_2}</math> | !<math>\frac{a_1}{a_2} \ne \frac{b_1}{b_2}</math> | ||
| | |प्रतिच्छेदी रेखाएँ | ||
| | |सटीक रूप से एक हल (अद्वितीय) | ||
|- | |- | ||
|2 | |2 | ||
| Line 59: | Line 60: | ||
!<math>\frac{-9}{-18}</math> | !<math>\frac{-9}{-18}</math> | ||
!<math>\frac{a_1}{a_2}=\frac{b_1}{b_2}=\frac{c_1}{c_2}</math> | !<math>\frac{a_1}{a_2}=\frac{b_1}{b_2}=\frac{c_1}{c_2}</math> | ||
| | |संयोग रेखाएँ | ||
| | |अनंत अनेक हल | ||
|- | |- | ||
|3 | |3 | ||
| Line 70: | Line 71: | ||
!<math>\frac{-4}{-12}</math> | !<math>\frac{-4}{-12}</math> | ||
!<math>\frac{a_1}{a_2}=\frac{b_1}{b_2}\ne \frac{c_1}{c_2}</math> | !<math>\frac{a_1}{a_2}=\frac{b_1}{b_2}\ne \frac{c_1}{c_2}</math> | ||
| | |समानांतर रेखाएँ | ||
| | |कोई हल नहीं | ||
|} | |} | ||
उपरोक्त तालिका से, यदि समीकरण द्वारा दर्शाई गई रेखाएँ | |||
<math>a_1x+b_1y+c_1=0 ....(1)</math> और <math>a_2x+b_2y+c_2=0 ....(2)</math> | <math>a_1x+b_1y+c_1=0 ....(1)</math> और <math>a_2x+b_2y+c_2=0 ....(2)</math> हैं | ||
* | * प्रतिच्छेद करते हुए, फिर <math>\frac{a_1}{a_2}\ne \frac{b_1}{b_2}</math> | ||
* | * संपाती, तो <math>\frac{a_1}{a_2}=\frac{b_1}{b_2}= \frac{c_1}{c_2}</math> | ||
* | * समांतर,फिर <math>\frac{a_1}{a_2}=\frac{b_1}{b_2}\ne \frac{c_1}{c_2}</math> | ||
== | == उदाहरण == | ||
1. Check graphically whether the pair of equations | 1. Check graphically whether the pair of equations | ||
{| class="wikitable" | {| class="wikitable" | ||
| Line 90: | Line 91: | ||
|}is consistent. If so, solve them graphically. | |}is consistent. If so, solve them graphically. | ||
''' | '''हल :''' | ||
{| class="wikitable" | {| class="wikitable" | ||
|<math>x</math> | |<math>x</math> | ||
Revision as of 08:27, 20 September 2024
जब गणितीय संक्रियाओं के साथ चरों और अचरों के गणितीय व्यंजक उच्चतम घात एक का समीकरण बनाते हैं, तो इसे एक रैखिक समीकरण कहा जाता है। रैखिक समीकरण चरों के बीच एक बीजीय समीकरण है जो आलेख पर अंकित करने पर एक सीधी रेखा देता है। एक चर का एक रैखिक समीकरण इस प्रकार का होता है जहां चर है। दो चरों के रैखिक समीकरण इस रूप के होते हैं जहाँ और दो चर हैं और स्थिरांक है। रैखिक समीकरणों की एक युग्म को दो मूल विधियों का उपयोग करके हल किया जा सकता है और दर्शाया जा सकता है: आलेखीय विधि और बीजगणितीय विधि। इस पाठ में, हम आलेखीय विधि का उपयोग करके दो रैखिक समीकरणों की एक प्रणाली को हल करने की विधि को ज्ञात करेंगे।
रैखिक समीकरण युग्म को आलेखीय रूप से हल करना
प्रत्येक रैखिक समीकरण में चर होते हैं। रैखिक समीकरण प्रथम कोटि के होते हैं और इनमें एक या दो चर उपस्थित हो सकते हैं। जब आलेखीय पद्धति का उपयोग करके रैखिक समीकरणों को हल करने की बात आती है तो मूल दृष्टिकोण उन्हें आलेख पर सीधी रेखाओं के रूप में प्रस्तुत करना और प्रतिच्छेदन बिंदु, यदि कोई हो, ज्ञात करना होता है। हम के मानों को प्रतिस्थापित करके, और अंतःखंडों को ज्ञात करके और उन्हें आलेख पर ज्यामितीय रूप से आलेखन(प्लॉट) करके न्यूनतम दो समाधान सुलभ पद्धति से प्राप्त कर सकते हैं। आइए यहां रैखिक समीकरणों के एक युग्म के मानक रूप पर एक दृष्टि डालें।
समीकरणों का हल रेखाओं की स्थिति के अनुसार भिन्न-भिन्न होता है।
हल के प्रकार
- संगत: समीकरणों के युग्म को संगत कहा जाता है, यदि दो रेखाएँ एक ही बिंदु पर प्रतिच्छेद कर रही हों, तो वह बिंदु दोनों समीकरणों के लिए एक अद्वितीय हल देता है।
- आश्रित: समीकरणों के युग्म को आश्रित कहा जाता है, यदि दो रेखाएँ संपाती हों, तो इस स्थिति में अनंत रूप से कई हल होते हैं। एक रेखा पर प्रत्येक बिंदु एक हल बन जाता है।
- असंगत: समीकरणों के युग्म को असंगत कहा जाता है, यदि दो रेखाएँ समानांतर हों, तो इस स्थिति में कोई हल नहीं होता है।
समीकरणों के निम्नलिखित तीन युग्मों पर विचार करें।
(i) और (रेखाएँ प्रतिच्छेद करती हैं )
(ii) और (रेखाएँ संपाती हैं )
(iii) और (रेखाएँ समांतर हैं )
आइए उपर्युक्त तीनों उदाहरणों में के मान लिखें और उनकी तुलना करें।
यहाँ और सामान्य रूप और में दिए गए समीकरणों के गुणांकों को दर्शाता है
| क्रमांक | रेखाओं का युग्म | अनुपातों की तुलना | आलेखीय विधि | बीजगणितीय व्याख्या | |||
|---|---|---|---|---|---|---|---|
| 1 |
|
प्रतिच्छेदी रेखाएँ | सटीक रूप से एक हल (अद्वितीय) | ||||
| 2 |
|
संयोग रेखाएँ | अनंत अनेक हल | ||||
| 3 |
|
समानांतर रेखाएँ | कोई हल नहीं |
उपरोक्त तालिका से, यदि समीकरण द्वारा दर्शाई गई रेखाएँ
और हैं
- प्रतिच्छेद करते हुए, फिर
- संपाती, तो
- समांतर,फिर
उदाहरण
1. Check graphically whether the pair of equations
|
|
is consistent. If so, solve them graphically.
हल :
Plot the points on the graph paper
- , and join the points to form the lines
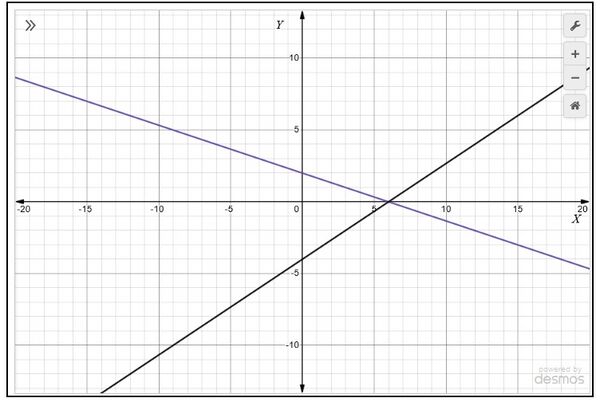
- and join the points to form the lines as shown in Fig. 1.
We observe that there is a point at common to both the lines . So, the solution of the pair of linear equations is and , i.e., the given pair of equations
is consistent.
2. Check graphically whether the pair of equations
|
|
has infinitely many solutions. If so, solve them graphically.
Solution:
Plot the points on the graph paper
- , and join the points to form the lines
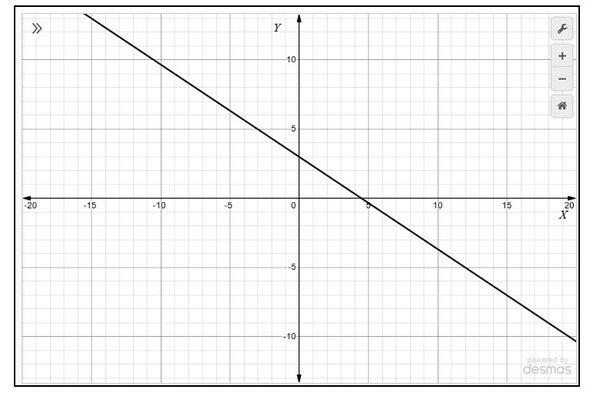
- and join the points to form the lines as shown in Fig. 2.
We observe that each and every point on a line becomes a solution. So, the solution of the pair of linear equations has infinitely many solutions.
3. Check graphically whether the pair of equations
|
|
has no solution, If so, solve them graphically.
Solution:
Plot the points on the graph paper
- , and join the points to form the lines
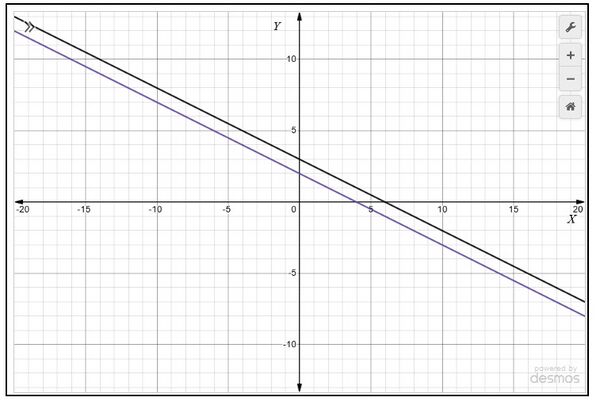
- and join the points to form the lines as shown in Fig. 3
We observe that lines are not crossing and are parallel to each other . So, the pair of linear equations has no solution.


